
Technical details
What is real time PCR?
Real time PCR (qPCR) is a robust and highly sensitive technique used to simultaneously quantify and identify specific nucleotide sequences (DNA, mRNA and miRNA) in cells or tissues. Fluorescent probes (Taqman or Universal Probe) are used to quantify the PCR product at each amplification step by detecting the emitted fluorescence in real time.
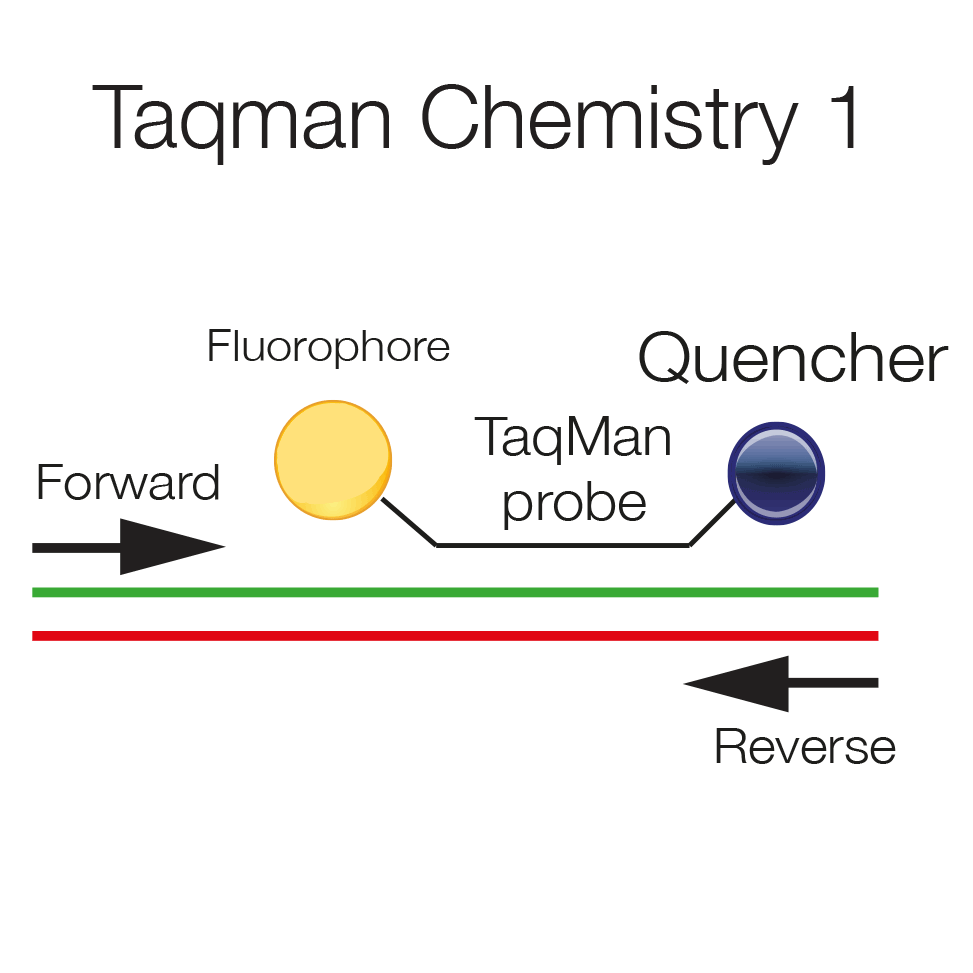
Taqman probes are hydrolysis probes, which are labeled at the 5' end with a fluorophore and at the 3' end with a quencher. The vicinity of the two quenches the fluorescent signal. The probe hybridizes to the template and will be displaced as polymerization proceeds.
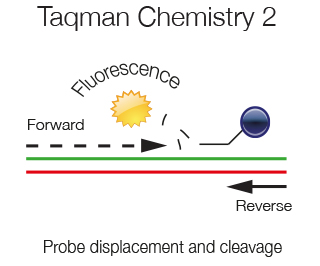
As the amplification of the template proceeds the displaced probe is degraded by the 5'exonuclease activity of the Taq polymerase. Fluorophore and Quencher are no more in vicinity and a fluorescent signal is emitted. At each amplification step the PCR product generated and the fluorescence generated are directly proportional.
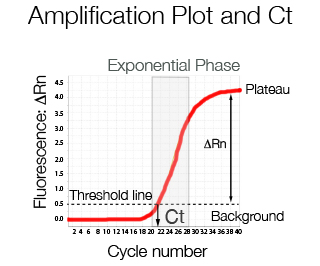
At low cycle number the fluorescence emitted represents background noise. Once the increase in fluorescence is linear, a threshold line can be used to divide the background level from the specific signal. The difference between the total fluorescence emitted and the background is called ΔRn and is the fluorescence value typically displayed in an amplification plot. The cycle number in which the amplification curve crosses the threshold line is called crossing point Cp or Ct or according to MIQE guidelines Cq, quantification cycle.
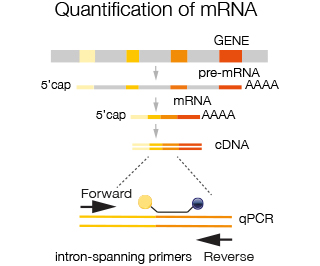
For quantification of mRNA intron spanning primers are used i.e. primers that reside in two different exons, in order to avoid amplification of contaminating genomic DNA or pre-mRNA. Choosing the appropriate primers allows amplification of all transcripts from a given gene or specific transcripts derived from alternative splicing. Taqman probes are available for virtually all species and for human and mouse transcriptome basically all exons are covered. In case probes are not yet available, custom made probes can be ordered.
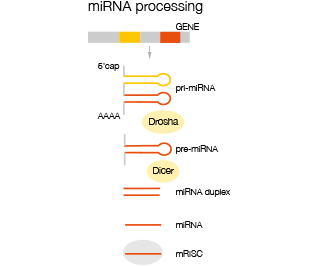
Mature mi-RNA are derived from a primary transcript of multiple mi-RNA precursors (pri-miRNA) which is processed to give rise to single mi-RNA precursors (pre-miRNA) before being further processed in the cytoplasm to mature mi-RNA which are then incorporated into the RISC comp complex where they are enzymatically active. Analysis of miRNA is differentiated into analysis of immature pri-miRNA and mature miRNA.
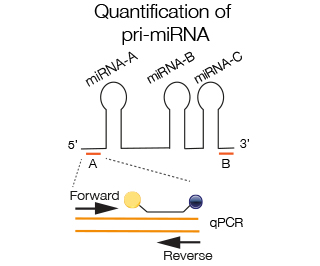
Primers close to the stem-loop region of the mi-RNA are chosen to amplify specific mi-RNA within a pri-miRNA complex (A). In some cases 2 miRNAs are so close that the space between is not sufficient for amplification, in that case the region next to the specific miRNA
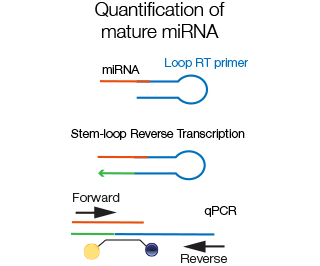
Since mature miRNA are very short, efficient amplification is best performed using loop-RT primers that partially anneal to the miRNA and partially to themselves, creating a hairpin structure. The specific taqman probe anneals to the miRNA sequence.
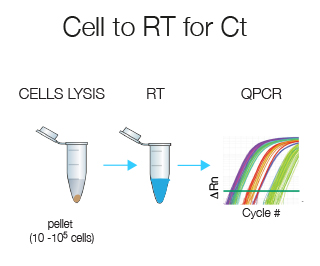
Cell-to-RT for Ct does all in one tube without prior RNA extraction and is designed for 10-105 cells. This technique is ideally suited if you have few cells.
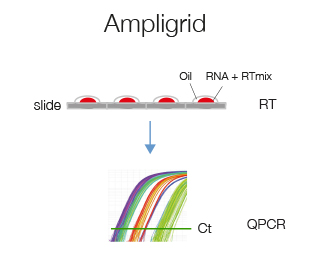
Ampligrid is a glass-slide microwell based retro-transcription protocol that starting from 2 ng of RNA will provide enough cDNA to analyze 2 genes by qPCR. We suggest this protocol if you have very little RNA.
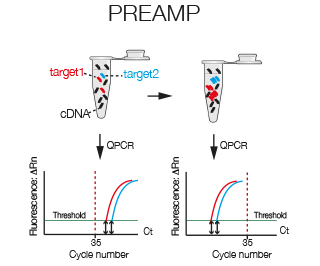
With PreAmp specific taqman amplicons are amplified prior to real time. PreAmp can be used to amplify up to a 100 amplicons simultaneously. If you have little template or your transcripts are of low abundance, PreAmp might be the right solution for you.
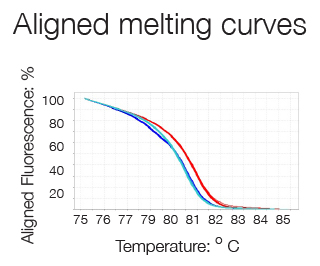
High Resolution Melting (HRM) analysis is a post-PCR technique used to identify genetic variation or the methylation status of genomic DNA. The region of interest is amplified in a reaction containing a double-strand DNA (dsDNA)–binding dye which fluoresces brightly only when bound to dsDNA. After the PCR, reactions are slowly heated in a real-time instrument. When the dsDNA dissociates (or melts) into single strands, the dye is released, causing a change in fluorescence. The result is a melt curve profile characteristic of a particular sequence.
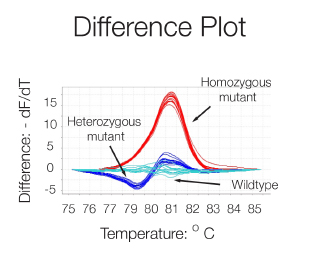
A difference plot of the melting curves i.e. a graph of the first negative derivation - dF/dT versus Temperature, allows a better visualization of differences in melting behavior and the determination of the dissociation temperature (50% dissociation) thanks to the peaks formed. The technique is sensitive enough to detect single nucleotide variations and thus can be used for allele discrimination.
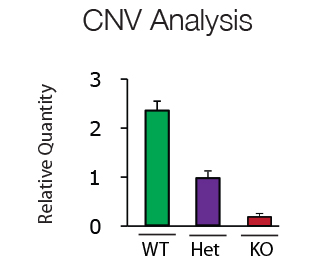
Copy number variations (CNV) are clinically important polymorphisms caused by either gene deletion, duplication or inversion. In addition CNV analysis can be used for genotyping of transgenic animals. CNV analysis using QPCR technology is fast, specific and easy to interpret.
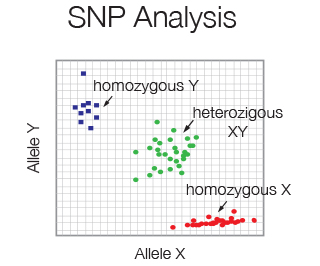
Single nucleotide polymorphism (SNP) is the most common type of genetic variation in the human genome. SNP frequency is easily determined using 2 differentially Taqman probes specific for either the wildtype or mutant allele. Little amount of starting material is required.
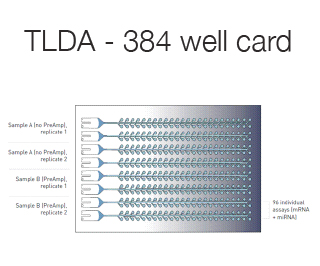
Taqman low-density array (TLDA) are custom made 384 well microfluidic cards that can accommodate 1-8 samples testing 12-384 different genes.
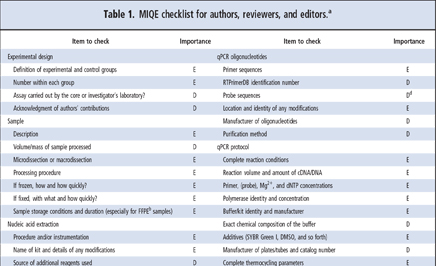
MIQE guidelines ask for the minimum information neccessary to allow the reproduction and quality assessment of a given qPCR based experiment. The information requested can be divided into the following sections:
- experimental design
- sample properties
- nucleic acid extraction and quality assessment
- reverse transcription
- target information
- primer and probe details
- qPCR protocol optimization and validation details
- data analysis
MIQE guidelines exist both for RT-QPCR and for Digital PCR
RT-PCR specific questions
Using RT-qPCR, absolute quantification can be obtained only after establishing a standard curve using a template (e.g. plasmid DNA) of known amount. Used to determine bacterial/viral load or exact copy number/cell.
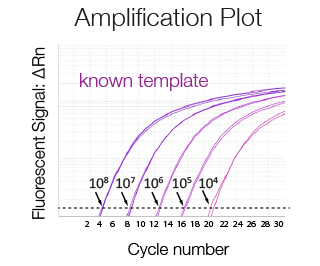
Amplification plot of a serially diluted sample of known concentration used to generate a standard curve. The higher the concentration of the template the lower the Ct.
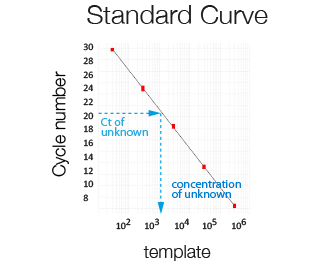
The template number in a sample of unknown concentration is extrapolated from its Ct using a standard curve.
Relative quantification compares the expression relative to a housekeeping gene and/or to another reference sample and is used to analyze gene expression for example over time or after drug treatment.
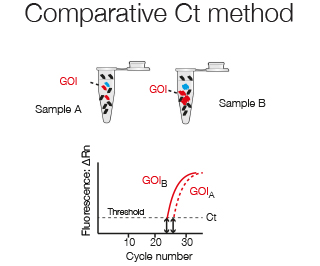
The comparitive Ct method compares the expression levels between two samples, for example Gene of Interest (GOI) in sample A versus sample B.
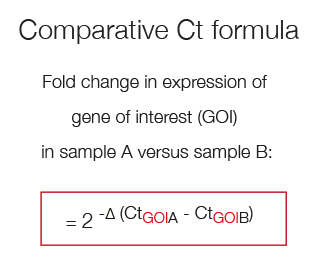
The fold change in expression of GOI in sample A versus sample B can be described by the log2 - fold difference in their Ct values.
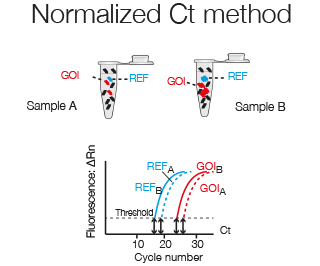
For normalization to a Reference gene, whose expression theoretically is identical in the two samples and thus corrects for total RNA levels, the Ct of the Reference gene (CtRef) is subtracted from the Ct of the Gene of Interest (CtGOI).
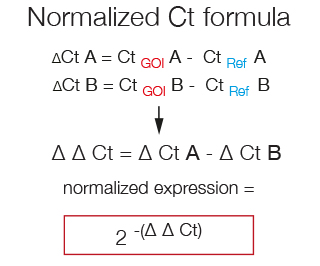
The formula used to calculate the fold-change in the expression of a Gene of Interest that takes into account its normalization to a Reference gene is called ΔΔCt. First the CtRef is substracted from the CtGOI in both samples and then the resulting ΔCt of sample B is substracted from the ΔCt of sample A.
In RT-PCR the PCR reaction is monitored in real-time at each amplification step. Analysis is performed when the amplification curve is linear (link to amplification plot and Ct). Digital PCR instead is an endpoint PCR in which the read-out is yes or no.
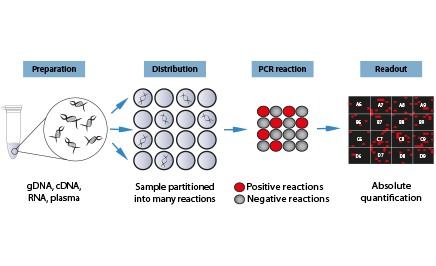
Digital PCR is a highly sensitive method for nucleic acid detection and ideally suited for absolute quantification and rare allele detection. Digital PCR works by partitioning a sample (template + PCR reaction mix) into many individual PCR reactions. The presence (positive reaction) or absence (negative reaction) of the targt molecule in each individual PCR reaction is revealed by endpoint PCR. The count of positive and negative reactions is then used to calculate the absolute amount of target molecules in the starting sample.
More informations
- A visual, interactive and practical qPCR guide free from itunes
- qPCR tutorials at thermo fisher
- Original article describing GeNorm for mRNA
- Original article describing GeNorm for miRNA
- Original article describing MIQE Guidelines for RT-QPCR
- Original article describing MIQE Guidelines for Digital PCR